Analyzing my Pit Wall Predictions
- Aug 21, 2024
- 6 min read
Since this is my first post, I should probably write some generic welcome message, maybe talk about myself or my goals with this blog ...but I don't feel like it. So, let's talk about Pit Wall Predictions.
If you have an account on the Williams Racing website/app, you can participate in this competition where you can predict what will happen in the race - a bit like the similar part of Fantasy Gp, but more Williams-specific. Every race week, there are eight questions about pit stops, safety cars, tyres, etc., where you have to select your prediction out of 3-5 possibilities, and if you end up being right, you get 5 points. You always know your score and standing, but not much else - like how many people are playing, what's the highest score, and whether anyone has ever made a perfect prediction.
Recently, Williams made a post about the current standings, which did include some of that information, and it sparked a conversation on Twitter about our progress. The discussion inspired me to look into what I could do better, so I decided to do some exploratory data analysis on the topic. The amount of data from the game didn't warrant the use of any advanced data analysis tools, so I just used a spreadsheet. (Truthfully, I could have used more data from other sources, but that is outside of the scope of this post.)
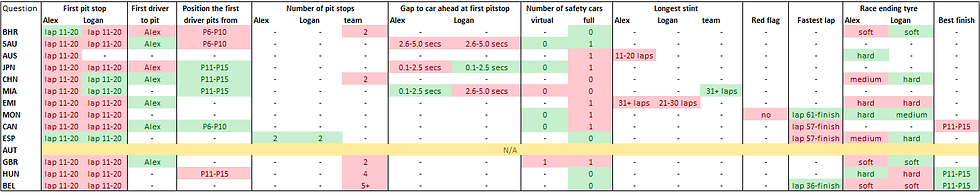
I know I could have made this table look nicer but I'm not really an aesthetics person, so this will have to do. The rows correspond to the race weekends, the columns correspond to questions asked (grouped by similarity), and each cell contains my answer, or "-" if that particular question was not asked that weekend. Correct answers are coloured green, and incorrect answers are coloured red. (Duh...)
Australia was a special race, because only Alex ended up participating, which made many questions irrelevant, which is how we ended up with only four questions. On the other hand, the data corresponding to Austria is missing for a much more mundane reason: I forgot to set my predictions that week. That's on me.
The first and most obvious observation is that I'm not very good at this game. I have exactly 200 points (40/100 correct answers), and according to the Williams website, the current #1 has 285 (57 correct answers). That is a lot of deficit. In fact, the main reason I decided to do this analysis is to find out if there is something I can do to improve - I am primarily looking for types of questions that can be answered in a smarter way than what I usually do (which is a couple of default answers and simple tricks, like checking the data on the last race on the track), but I'll settle for anything useful.
Before diving into my personal selection and success, I immediately noticed something about the frequency of the questions. While I noticed before that some questions are asked more frequently than others, I never realized the number of full safety cars is always asked. This will be something that is worth diving into.
Now, let's take a look at each type of question and analyze my results.
On which lap will the drivers make their first stop? It is a well-known rule of thumb among Pit Wall Prediction participants that the first pit stop usually happens around lap 11-20; which makes it really surprising that predicting that for both drivers, every race only resulted in points 5/25 times. That's only 20%. Instead, this year lap 1-10 would have been the winner, which would have gotten me twice as many points. Although this is one of those questions where it would probably be beneficial to put some thought into the circumstances of each race, instead of just going with a default answer.
Which Williams racing driver will pit first? An easy question for now, as Alex Albon is almost always the answer, but it might get trickier next year. It will be interesting to see what happens. For now, Alex is a safe choice.
When the first Williams Racing driver pits, what position will they pit from? There's a bit more variability among the races, as well as my predictions here, but I usually start from P11-P15 and go from there, depending on the starting positions. Pitting is often a chain reaction among teams to avoid undercutting, and the drivers will often pit from a higher position than their usual position in that race, which makes this a particularly tricky question. As for the data, 4/7 times this question has been asked, P11-P15 was the correct answer.
How many pit stops will our drivers make? I usually start from the previous year's pit stops, but apparently, this is not a good strategy. Or maybe there were just too many extra pit stops this year. Interestingly, 2+2=4 was almost always the correct answer, except for that one time in Hungary, where that was my actual guess. So it is an important takeaway from this little exercise that it would be better to go with a default answer in this case.
When the drivers make their first stop, what will the gap between them and the car ahead be? I'm gonna be honest with you here: I hate this question. I do not understand its purpose or how I am supposed to predict a gap at a particular point in a race. However, 5/6 times, the correct answer was 0.1-2.5 seconds (with the outlier being "no stop made"), which does suggest a default answer. That being said, this question was only asked in three races, which is not enough data to draw any significant conclusion.
How many full/virtual Safety Car periods will there be? I have said this earlier, the full safety car question always gets asked, but its virtual counterpart is frequent in the Pit Wall Predictions game, too. From my results, I seem to be doing better on the virtual safety car question, but that is simply because I always select 0, whereas, for the full safety car, I try to guess between 0 and 1, which are the usual suspects but my guess is only correct about 50% of the time. The distribution of the correct answers so far this year suggests it would be better to always go with 0, too, as 9/13 times that is the correct answer, while 2-2 races had one and two full safety cars.
Either way, this is actually a pretty fun question - there are educated guesses, but there's enough randomness to it. I am quite fond of it.
Which tyres will the drivers end the race on? This is one of those questions where I could probably have made more educated guesses instead of guessing randomly, e.g. by checking proposed tyre strategies or even by using common sense: the results show that in 9/17 cases, the answer was the hard compound.
As for the remaining questions, there simply isn't enough data to draw any conclusions - at least in the game. I say that because there is actually quite a lot of available data in general: the entire database of Formula 1 races (at least whatever information is public). Obviously, a lot of these questions are way too specific for this team and its current circumstances, but the more general questions (e.g. safety cars, red flags) could be assisted by looking into the data. In fact, James Vowles himself said in a Vowles Verdict that for the tyre strategy, they checked the number of safety cars for that particular track in the last 20 years.
That was my data analysis. It shall be interesting to see in the remainder of the seasons how this knowledge will affect my results. On the one hand, a lot of this information can be useful in the future. On the other hand, Williams is coming back after the summer break with updates, which may make this data irrelevant. We shall see. Good luck to anyone participating!
PS: This is the first post on this blog; I'm still at the start of the learning curve. In fact, if you can see this post, that is in itself a huge achievement because, at the time of writing, the blog isn't even online yet. Please be patient.
Soon, I will publish a longer post about my experiences at the Hungarian GP, which I attended in person (only on Friday). I hope it will be useful to those who are thinking about attending in the future.
Rebus T. Farkas


Comments